1 Linear Regression and Least Squares
This chapter marks the beginning of our journey into Machine Learning (ML), and we start with a familiar topic: Linear Regression, which is most commonly solved using the method of Least Squares (LS). While many of you will have encountered Least Squares before, our goal here is not so much to provide a primer. Instead, we will revisit this classical technique through the modern lens of Machine Learning.
It is often forgotten, but Least Squares can be considered the original Machine Learning algorithm. By examining it, we can introduce many of the fundamental concepts that form the bedrock of modern ML. These include the distinction between training and testing data, the challenges of overfitting and underfitting, the role of regularisation, the modelling of noise and the concept of a loss function. Understanding these ideas is key, as they are central to virtually all Machine Learning techniques we will explore.
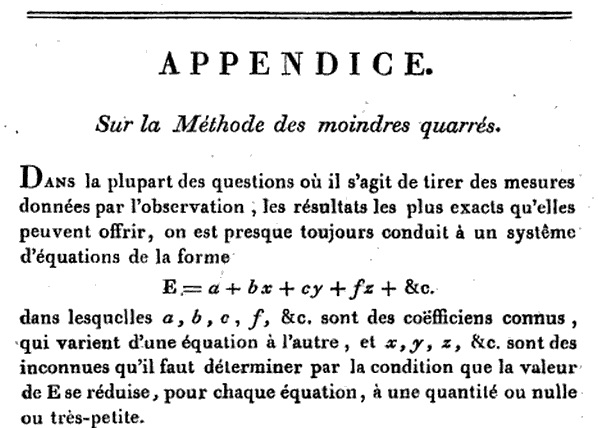
The method of least squares has its origins in astronomy, where it was developed to calculate the orbits of celestial bodies. It is often credited to Carl Friedrich Gauss, who published it in 1809, but it was first described by Adrien-Marie Legendre in 1805. The priority dispute arose from Gauss’s claim to have been using the method since 1795.
1.1 The Linear Model and Notations
Let us begin with a simple, practical example. Imagine we have collected data on the height and weight of a group of people, as shown in Figure 1.2. Our goal is to build a model that can predict a person’s weight based on their height.

In the language of Machine Learning, we define the following:
The input to our predictive model is a set of features, represented by a vector (x_1, \cdots, x_p). In this simple case, we have only one feature, x_1, which is a person’s height in centimetres.
The output of the model is a scalar value, y. Here, y is the person’s weight in kilograms. It is straightforward to generalise this to a vector of outputs by treating each component as a separate scalar prediction problem.
The model defines the relationship between the input features and the output. For linear regression, we assume this relationship is linear:
y = w_0 + w_1 x_{1} + w_2 x_{2} + w_3 x_{3} + \cdots + w_p x_{p}
For our height-weight example, a well-fitting model might look like this:
\mathrm{weight (kg)} = 0.972 \times \mathrm{height (cm)} - 99.5
The parameters of the model, (w_0, w_1, \dots, w_p), are called the weights. The term w_0 is often called the bias or intercept. The mathematical notations used here are strongly established conventions in Machine Learning, and we will adhere to them throughout this module. Note, however, that ML is an interdisciplinary field, and conventions can sometimes conflict. For instance, in Statistics, the model parameters are instead denoted as \beta_0, \beta_1, \dots, \beta_p.
Let us formalise the problem. We have a dataset consisting of n observations. For each observation i, we have a vector of p features (x_{i1}, x_{i2}, \dots, x_{ip}) and a corresponding output y_i. The linear model for each observation is:
\begin{aligned} y_1 &= w_0 + w_1 x_{11} + w_2 x_{12} + \cdots + w_p x_{1p} + \varepsilon_1 \\ y_2 &= w_0 + w_1 x_{21} + w_2 x_{22} + \cdots + w_p x_{2p} + \varepsilon_2 \\ & \vdots & \\ y_n &= w_0 + w_1 x_{n1} + w_2 x_{n2} + \cdots + w_p x_{np} + \varepsilon_n \end{aligned}
Again, we will stick to these notations throughout the module and n will always represent the number of observations/number of points in your dataset, and p the number of features.
Since a simple linear model cannot perfectly capture the complexity of the real world, we have introduced an error term, \varepsilon_i, for each observation. This term represents the difference between our model’s prediction and the actual observed value y_i.
Our objective is to find the set of weights (w_0, w_1, \cdots, w_p) that makes the errors as small as possible. However, the errors (\varepsilon_1, \dots, \varepsilon_n) form a vector, and we cannot directly minimise a vector. We need to aggregate these n error values into a single scalar quantity that we can compare and use for optimisation.
In Least Squares, this is achieved using the Mean Squared Error (MSE), which is the average of the squared errors:
E = \frac{1}{n} \sum_{i=1}^{n} \varepsilon_i^2 = \frac{1}{n} \sum_{i=1}^{n} \left( w_0 + w_1 x_{i1} + \cdots + w_p x_{ip} - y_i \right)^2
The choice of the Mean Squared Error is the defining aspect of Least Squares. While other metrics are possible (such as the mean absolute difference), the MSE is mathematically convenient and, as we will see, has a deep probabilistic justification. In Machine Learning, the function that measures the model’s error is called the loss function. Our goal is to find the weights that minimise this loss function.
1.2 Optimisation
To find the optimal values for the weights (w_0, \dots, w_p) that minimise the MSE, we can use calculus. The MSE, E(w_0, \dots, w_p), is a convex function of the weights. Therefore, its minimum occurs where its gradient is zero; that is, where all its partial derivatives with respect to each weight are equal to zero.
\frac{\partial E}{\partial w_0} = 0, \quad \frac{\partial E}{\partial w_1} = 0, \quad \cdots, \quad \frac{\partial E}{\partial w_p} = 0
Let us compute these partial derivatives for our MSE loss function: E(w_0,\cdots,w_p) = \frac{1}{n} \sum_{i=1}^{n} \left( w_0 + w_1 x_{i1} + \cdots + w_p x_{ip} - y_i \right)^2
\begin{aligned} \frac{\partial E}{\partial w_0} &= \frac{2}{n} \sum_{i=1}^{n} \left( w_0 + w_1 x_{i1} + \cdots + w_p x_{ip} - y_i \right) = 0 \\ \frac{\partial E}{\partial w_1} &= \frac{2}{n} \sum_{i=1}^{n} x_{i1} \left( w_0 + w_1 x_{i1} + \cdots + w_p x_{ip} - y_i \right) = 0 \\ & \vdots \\ \frac{\partial E}{\partial w_p} &= \frac{2}{n} \sum_{i=1}^{n} x_{ip} \left( w_0 + w_1 x_{i1} + \cdots + w_p x_{ip} - y_i \right) = 0 \end{aligned}
Rearranging these terms and dividing by 2/n, we obtain a system of p+1 linear equations in p+1 unknowns (w_0, \dots, w_p):
\begin{alignat*}{5} & w_0 \sum_{i=1}^n 1 && + w_1 \sum_{i=1}^n x_{i1} && +\cdots && + w_p \sum_{i=1}^n x_{ip} && = \sum_{i=1}^n y_i \\ & w_0 \sum_{i=1}^n x_{i1} && + w_1 \sum_{i=1}^n x_{i1}^2 && +\cdots && + w_p \sum_{i=1}^n x_{i1}x_{ip} && = \sum_{i=1}^n x_{i1} y_i \\ & && \vdots && \vdots && \vdots && \vdots \\ & w_0 \sum_{i=1}^n x_{ip} && + w_1 \sum_{i=1}^n x_{ip}x_{i1} && +\cdots && + w_p \sum_{i=1}^n x_{ip}^2 && = \sum_{i=1}^n x_{ip} y_i \end{alignat*}
This system of equations can be solved efficiently using standard linear algebra methods.
1.2.1 Matrix Notation
While the summation notation is explicit, it quickly becomes cumbersome. Deriving these equations using matrix notation is more elegant. By convention, we denote scalars with a lowercase letter (y), vectors with a bold lowercase letter (\mathbf{w}), and matrices with a bold uppercase letter (\mathbf{X}).
Let us define the following: \mathbf {y} = \begin{pmatrix} y_{1}\\ y_{2}\\ \vdots \\ y_{n} \end{pmatrix}, \, \mathbf {x}_i = \begin{pmatrix} 1 \\ x_{i1}\\ x_{i2}\\ \vdots \\ x_{ip} \end{pmatrix}, \, \mathbf{w} = \begin{pmatrix} w_{0} \\ w_{1} \\ \vdots \\ w_{p} \end{pmatrix}, \, \boldsymbol{\varepsilon} = \begin{pmatrix} \varepsilon_{1}\\ \varepsilon_{2}\\ \vdots \\ \varepsilon_{n} \end{pmatrix},
To handle the bias w_0 as any of the other weights, we have augmented the feature vector with a made-up feature x_{i0}=1. Doing this allows us to write our model in a compact way:
\begin{aligned} y_i &= w_0 \times 1 + w_1 x_{i1} + \cdots + w_p x_{ip} + \varepsilon_i \\ & = \mathbf {x}_i ^T\mathbf {w} + \varepsilon_i \end{aligned}
We can combine this for all observations by introducing the matrix \mathbf{X}, which contains all our input features for all n observations:
\mathbf{X} = \begin{pmatrix} 1 & x_{11} & \cdots & x_{1p} \\ 1 & x_{21} & \cdots & x_{2p} \\ \vdots & \vdots & \ddots & \vdots \\ 1 & x_{n1} & \cdots & x_{np} \end{pmatrix}
As mentioned earlier, the first column of ones is included to accommodate the bias term w_0. This important matrix is known as the Design Matrix.
Using these definitions, our entire system of n linear equations can be written compactly as: \mathbf {y} = \mathbf{X} \mathbf{w} + \boldsymbol{\varepsilon}
The MSE loss function can also be expressed neatly in matrix form. The sum of squared errors, \sum \varepsilon_i^2, is equivalent to the squared Euclidean norm of the error vector, ||\boldsymbol{\varepsilon}||^2, which can be written as the dot product \boldsymbol{\varepsilon}^{\top}\boldsymbol{\varepsilon}.
\begin{aligned} E(\mathbf{w}) &= \frac{1}{n} \sum_{i=1}^n \varepsilon_i^2 = \frac{1}{n} \boldsymbol{\varepsilon}^{\top} \boldsymbol{\varepsilon} = \frac{1}{n} || \boldsymbol{\varepsilon} ||^2 \\ &= \frac{1}{n} ( \mathbf{X} \mathbf{w} - \mathbf {y} )^{\top} ( \mathbf{X} \mathbf{w} - \mathbf {y} ) \\ &= \frac{1}{n} ( \mathbf{w}^{\top} \mathbf{X}^{\top}\mathbf{X} \mathbf{w} - 2 \mathbf{w}^{\top}\mathbf{X}^{\top}\mathbf {y} + \mathbf {y}^{\top}\mathbf {y} ) \end{aligned}
To find the minimum of E(\mathbf{w}), we need to compute its gradient with respect to the vector \mathbf{w}, denoted \nabla_{\mathbf{w}} E or \frac{\partial E}{\partial \mathbf{w}}, and set it to the zero vector. \frac{\partial E}{\partial \mathbf{w}} = \left( \frac{\partial E}{\partial w_0}, \cdots, \frac{\partial E}{\partial w_p} \right)^{\top} = \mathbf{0}
Knowing a few standard results for vector calculus is very useful. Below is a list of common matrix derivative identities, assuming that \mathbf{a}, \mathbf{b}, \mathbf {A} are independent of \mathbf {w}.
\begin{alignat*}{3} & {\frac {\partial {\mathbf{a}}^{\top }{\mathbf {w}}}{\partial {\mathbf {w}}}} &&= {\mathbf {a}} && \\ & {\frac {\partial {\mathbf {b}}^{\top }{\mathbf {A}}{\mathbf {w}}}{\partial {\mathbf {w}}}} && = {\mathbf {A}}^{\top }{\mathbf {b}} && \\ & {\frac {\partial {\mathbf {w}}^{\top }{\mathbf {A}}{\mathbf {w}}}{\partial {\mathbf {w}}}} && = ({ \mathbf {A}}+{\mathbf {A}}^{\top }){ \mathbf {w}} && \quad \text{(or $2\mathbf{A}\mathbf{w}$ if A is symmetric)} \\ & \frac {\partial {\mathbf {w}}^{\top }{\mathbf {w}}}{\partial {\mathbf {w}}} && = 2{\mathbf {w}} && \\ & {\frac {\partial \;{\mathbf {a}}^{\top }{\mathbf {w}}{\mathbf {w}}^{\top }{\mathbf {b}}}{\partial \;{\mathbf {w}}}} && = ({\mathbf {a}}{\mathbf {b}}^{\top }+{\mathbf {b}}{\mathbf {a}}^{\top }){\mathbf {w}} && \\ \end{alignat*}
Let us now apply these rules to our loss function: \begin{aligned} \frac{\partial E}{\partial \mathbf{w} } &= \frac{1}{n} \frac{\partial }{\partial \mathbf{w} } \left( \mathbf{w}^{\top} \mathbf{X}^{\top}\mathbf{X} \mathbf{w} - 2 \mathbf{w}^{\top}\mathbf{X}^{\top}\mathbf {y} + \mathbf {y}^{\top}\mathbf {y} \right) \end{aligned}
Applying the formulas to each term (noting that \mathbf{X}^{\top}\mathbf{X} is symmetric): \begin{aligned} \frac{\partial}{\partial \mathbf{w} } \left( \mathbf{w}^{\top} (\mathbf{X}^{\top}\mathbf{X}) \mathbf{w} \right) &= 2 \mathbf{X}^{\top}\mathbf{X} \mathbf{w} \\ \frac{\partial}{\partial \mathbf{w} } \left( \mathbf {y}^{\top}\mathbf {y} \right) &= \mathbf{0} \\ \frac{\partial}{\partial \mathbf{w} } \left( -2 \mathbf{w}^{\top}\mathbf{X}^{\top}\mathbf {y} \right) &= -2 \mathbf{X}^{\top}\mathbf {y} \end{aligned}
Combining these results, we get the gradient: \frac{\partial E}{\partial \mathbf{w} } = \frac{2}{n} (\mathbf{X}^{\top} \mathbf{X} \mathbf{w} - \mathbf{X}^{\top} \mathbf{y})
Setting the gradient to zero gives the normal equations: \mathbf{X}^{\top} \mathbf{X} \mathbf{w} = \mathbf{X}^{\top} \mathbf{y}
This is the same linear system we derived earlier, but expressed in a much more compact and powerful notation. Assuming the matrix \mathbf{X}^{\top} \mathbf{X} is invertible, we can solve for the optimal weight vector \hat{\mathbf{w}} directly: \hat{\mathbf{w}} = (\mathbf{X}^{\top} \mathbf{X})^{-1} \mathbf{X}^{\top} \mathbf{y}
1.3 Least Squares in Practice
Now that we have derived the theory, let us see how it can be used in practice.
1.3.1 A Simple Affine Example
Let us return to our initial height-weight example. The model is a simple affine function: y = w_0 + w_1 x. The design matrix \mathbf{X} stacks the single feature x_i for each person, along with a column of ones for the bias term:
\mathbf{X} = {\begin{pmatrix} 1&x_{1} \\ 1&x_{2} \\ \vdots &\vdots \\ 1&x_{n} \\ \end{pmatrix}}
The components of the normal equations are: \mathbf{X}^{\top} \mathbf{X} = {\begin{pmatrix} n & \sum x_i \\ \sum x_i & \sum x_i^2 \\ \end{pmatrix}}; \quad \mathbf{X}^{\top} \mathbf{y} = {\begin{pmatrix} \sum y_i \\ \sum x_i y_i \end{pmatrix}}
Solving for \hat{\mathbf{w}} = (\mathbf{X}^{\top} \mathbf{X})^{-1} \mathbf{X}^{\top} \mathbf{y} with the collected data gives the estimated weights \hat{\mathbf{w}} = \begin{pmatrix} -99.5 \\ 0.972 \end{pmatrix}. This corresponds to the linear model we saw earlier: \mathrm{weight} = 0.972 \times \mathrm{height} - 99.5
1.3.2 Transforming Input Features
A key aspect is that although the model must be linear in the parameters \mathbf{w}, it does not have to be linear in the original input features \mathbf{x}. A model is considered linear if it can be written as a linear combination of functions of the input features: y = f(\mathbf{x}, \mathbf{w}) = \sum_{i=0}^p w_i \phi_i(\mathbf{x}) where the basis functions \phi_i(\mathbf{x}) do not depend on the weights \mathbf{w}.
This means we can fit non-linear relationships by first transforming our raw inputs. For example, we can fit a cubic polynomial model: y = w_0 + w_1 x + w_2 x^2 + w_3 x^3 This is still a linear model in the sense that y is a linear combination of the new features \phi_0(x)=1, \phi_1(x)=x, \phi_2(x)=x^2, and \phi_3(x)=x^3.
Many other transformations can be used. For instance, y = w_0 + w_1 \cos(2\pi x) + w_2 \sin(2\pi x) is also a linear model in the parameters w_0, w_1, w_2, where the feature vector has been transformed to [1, \cos(2\pi x), \sin(2\pi x)]. In contrast, a model like y = w_0^2 + x is not linear in the parameters, because the term w_0^2 is not linear in w_0.
Similarly, we can transform the output variable. For instance, if we have collected 2D points (x_{1i}, x_{2i}) that lie on a circle centred at the origin, we could define a new output y_i = \sqrt{x_{1i}^2 + x_{2i}^2} and fit a simple model y = w_0 to find the radius.
This idea of transforming input features is at the core of many Machine Learning techniques. However, as we will see later in Section 1.8, this practice is not entirely without consequences.
1.3.3 Polynomial Fitting
Let us examine the use of feature transforms in more detail by looking at polynomial fitting, a particularly instructive example for ML. Consider the small dataset (x_i, y_i) plotted below. Let us assume we know that the true relationship is quadratic, of the form: y = w_0 + w_1 x + w_2 x^2.

To fit this model, we transform our single feature x into a new feature vector [1, x, x^2]. The design matrix \mathbf{X} becomes: \mathbf{X} = {\begin{pmatrix} 1&x_{1}& x_{1}^2 \\ 1&x_{2}& x_{2}^2 \\ \vdots &\vdots &\vdots \\ 1&x_{n}& x_{n}^2 \\ \end{pmatrix}}
The components of the normal equations are then: \mathbf{X}^{\top} \mathbf{X} = {\begin{pmatrix} \sum x_i^0 & \sum x_i^1 & \sum x_i^2 \\ \sum x_i^1 & \sum x_i^2 & \sum x_i^3 \\ \sum x_i^2 & \sum x_i^3 & \sum x_i^4 \end{pmatrix}} ;, \quad \mathbf{X}^{\top} \mathbf{y} = {\begin{pmatrix} \sum y_i x_i^0 \\ \sum y_i x_i^1 \\ \sum y_i x_i^2 \end{pmatrix}}
Solving for \hat{\mathbf{w}} = (\mathbf{X}^{\top} \mathbf{X})^{-1} \mathbf{X}^{\top} \mathbf{y} gives the following estimated curve, which matches the ground truth well.

1.4 Underfitting
What happens if we choose a model that is too simple for the data? For example, let us try to fit a linear model (order 1), y = w_0 + w_1 x, to our quadratic data.

The resulting fit is poor, with a large MSE error. The straight line is unable to capture the curvature present in the data. This problem is called underfitting. It occurs when the model is not complex enough to capture the underlying patterns in the training data.
We know we are underfitting when the model performs poorly even on the data it was trained on; that is, the training loss (e.g., MSE) remains high.
To remedy underfitting, we should consider using a more complex model, for instance, by increasing the degree of the polynomial.
1.5 Overfitting
Now, let us consider the opposite problem. What if we use a model that is too complex? Let us try to fit a 9th-order polynomial, y = w_0 + w_1 x + \cdots + w_9 x^9, to our small dataset.

The curve now passes perfectly through every data point, and the training error is virtually zero. However, the model exhibits wild oscillations between the points. It is clear that its predictions for any new data would be very poor. This phenomenon is called overfitting, and it is one of the most fundamental challenges in Machine Learning.
Overfitting occurs when a model learns the training data too well, capturing not only the underlying pattern but also the random noise specific to that dataset. The model has high variance and fails to generalise to new, unseen data.
This is why we must always evaluate our model on a separate test set—a portion of data that was held out and not used during training. Overfitting is occurring if the model’s error on the training set is very low, but its error on the test set is significantly higher.
We have overfitting when the training error is a poor indicator of a model’s true performance. That is, when the error on the training set is low, but the error on the test set is high.
There are two primary ways to combat overfitting:
Use a simpler model: If the model is too complex for the amount of data available, reducing its complexity (e.g., using a lower-degree polynomial) can prevent it from fitting the noise.
Get more data: This is almost always the best solution. A larger and more representative dataset will naturally constrain a complex model, forcing it to learn the true underlying pattern. If some features are not useful, their corresponding weights w_i will tend towards zero as more data is provided.
The figure below shows what happens when we fit the same 9th-order polynomial to a much denser dataset. The fit is now very close to the true quadratic model, and the wild oscillations have disappeared. Thanks to the large amount of data, the estimated weight for the x^9 term is now close to zero (w_9=\small -1.83\!\times\! 10^{-8}), as it should be.

Note that a small amount of overfitting is not always a bad thing. One would expect a model to perform better on examples it has seen many times before. In practice, some gap between training and test performance is normal, and aggressively avoiding it might lead to underfitting.
1.6 Regularisation
What if we cannot get more data? While this may sometimes be a poor excuse, there are situations where data is genuinely scarce or expensive. In such cases, a go-to technique called regularisation can be used to control overfitting.
For Least Squares, a common regularisation technique is Tikhonov regularisation, also known as Ridge Regression or L2 regularisation. The idea is to add a penalty term to the loss function that discourages the model weights from becoming too large.
Instead of minimising the standard MSE, || \mathbf{X} \mathbf{w} - \mathbf{y} ||^2, we minimise a modified loss: E_{\text{reg}}(\mathbf{w}) = || \mathbf{X} \mathbf{w} - \mathbf{y} ||^2 + \alpha || \mathbf{w} ||^2 where || \mathbf{w} ||^2 = w_0^2 + w_1^2 + \cdots + w_p^2 is the squared L2-norm of the weight vector, and \alpha > 0 is a hyperparameter that controls the strength of the regularisation.
The effect of this penalty is to introduce a bias that pulls the estimated weights \mathbf{w} towards zero. The motivation is that, all else being equal, simpler models with smaller weights are generally more plausible. For example, the model \mathrm{weight} = 0.972 \times \mathrm{height} - 99.5 is a priori more likely to be correct than a model like \mathrm{weight} = 10^{10} \times \mathrm{height} - 10^{20} even if both produce a similar prediction error on the training data. Regularisation helps us favour the former.
Regularisation is often a necessary tool, but it is not a magic bullet. It helps prevent wild predictions for inputs far from the training data, but it does so by introducing a bias into the estimate. It should be seen as a way to incorporate prior beliefs into our model, not as a substitute for sufficient data.
Adding the Tikhonov regularisation term still yields a closed-form solution, which is a convenient property: \hat{\mathbf{w}}_{\text{reg}} = (\mathbf{X}^{\top}\mathbf{X} + \alpha \mathbf{I})^{-1} \mathbf{X}^{\top}\mathbf{y} where \mathbf{I} is the identity matrix.
Numerically, overfitting often arises because the problem is ill-posed or under-constrained, causing the matrix \mathbf{X}^{\top}\mathbf{X} to be singular (non-invertible) or poorly conditioned. Adding the term \alpha \mathbf{I} ensures that the matrix is always invertible, thus stabilising the solution. Of course, a better way to make the problem well-posed is to have enough data to properly constrain it.
So, go and get more data!
1.7 The Maximum Likelihood Perspective
Very early on, Gauss established a deep connection between Least Squares, the principles of probability, and the Gaussian (or Normal) distribution. This provides a probabilistic justification for using the Mean Squared Error as our loss function.
Recall our linear model: \mathbf{y} = \mathbf{X} \mathbf{w} + \boldsymbol{\varepsilon}
We can adopt a probabilistic view by making an explicit assumption about the nature of the error term \boldsymbol{\varepsilon}. Let us assume that the errors are drawn independently from a Gaussian distribution with a mean of zero and some variance \sigma^2. \varepsilon_i \sim \mathcal{N}(0, \sigma^2) The probability density function (pdf) for a single error term is: p(\varepsilon_i) = \frac{1}{\sqrt{2\pi\sigma^2}} \exp\left(-\frac{\varepsilon_i^2}{2\sigma^2}\right)

Given this assumption, we can calculate the likelihood of observing a particular output y_i given the input \mathbf{x}_i and model weights \mathbf{w}. Since \varepsilon_i = y_i - \mathbf{x}_i^{\top}\mathbf{w}, this is: p(y_i|\mathbf{x}_i, \mathbf{w}) = \frac{1}{\sqrt{2\pi\sigma^2}}\exp\left(-\frac{(y_i - \mathbf{x}_i^{\top}\mathbf{w})^2}{2\sigma^2}\right)
Assuming that all n observations are independent and identically distributed (i.i.d.), the likelihood of observing the entire dataset (\mathbf{X}, \mathbf{y}) is the product of the individual likelihoods: \begin{aligned} p(\mathbf{y}|\mathbf{X}, \mathbf{w}) &= \prod_{i=1}^n p(y_i|\mathbf{x}_i, \mathbf{w}) \\ &= \left(\frac{1}{\sqrt{2\pi\sigma^2}}\right)^n \exp\left(-\frac{1}{2\sigma^2} \sum_{i=1}^n (y_i - \mathbf{x}_i^{\top}\mathbf{w})^2\right) \end{aligned}
The principle of Maximum Likelihood Estimation (MLE) states that we should choose the parameters \mathbf{w} that make our observed data most probable. That is, we want to find the \mathbf{w} that maximises the likelihood function p(\mathbf{y}|\mathbf{X}, \mathbf{w}): \hat{\mathbf{w}}_{\text{ML}} = \arg\max_{\mathbf{w}} p(\mathbf{y}|\mathbf{X}, \mathbf{w})
For practical reasons, it is easier to work with the logarithm of the likelihood, as this turns the product into a sum and does not change the location of the maximum. Maximising the log-likelihood is equivalent to minimising the negative log-likelihood: \begin{aligned} \hat{\mathbf{w}}_{\text{ML}} &= \arg\min_{\mathbf{w}} - \log(p(\mathbf{y}|\mathbf{X}, \mathbf{w})) \\ &= \arg\min_{\mathbf{w}} - \log\left(\left(\frac{1}{\sqrt{2\pi\sigma^2}}\right)^n \exp\left(-\frac{1}{2\sigma^2} \sum_{i=1}^n (y_i - \mathbf{x}_i^{\top}\mathbf{w})^2\right)\right) \\ &= \arg\min_{\mathbf{w}} \left( n \log(\sqrt{2\pi\sigma^2}) + \frac{1}{2\sigma^2} \sum_{i=1}^n (y_i - \mathbf{x}_i^{\top}\mathbf{w})^2 \right) \end{aligned}
Since the terms n, \log(\sqrt{2\pi\sigma^2}), and 2\sigma^2 are positive constants with respect to \mathbf{w}, minimising this expression is equivalent to minimising: \hat{\mathbf{w}}_{\text{ML}} = \arg\min_{\mathbf{w}} \sum_{i=1}^n (y_i - \mathbf{x}_i^{\top}\mathbf{w})^2
This is precisely the same objective function as in the method of Least Squares. This remarkable result shows that the Least Squares estimate is identical to the Maximum Likelihood solution under the assumption of i.i.d. Gaussian noise. This establishes a fundamental link between the choice of a loss function and the implicit assumptions we make about the data’s error distribution.
Choosing the MSE loss is equivalent to assuming that the prediction error is normally distributed. If we were to choose a different loss function, it would correspond to a different assumption about the noise. For instance, choosing the Mean Absolute Error (MAE) loss, \sum |y_i - \mathbf{x}_i^{\top}\mathbf{w}|, is equivalent to assuming the error follows a Laplace distribution.
In conclusion, the choice of loss function should ideally be driven by our knowledge of the data-generating process. In practice, however, the choice is often guided by a combination of empirical performance on a test set and the mathematical convenience of optimisation.
1.8 Loss, Feature Transforms, and Noise
Here are a few examples to illustrate the intricate relationships between the loss function, feature transformations, and noise characteristics.
1.8.1 Example 1: Regression Towards the Mean
Consider the case where our input measurements themselves are noisy. The model is: y = (x + \nu) w + \epsilon where \nu \sim \mathcal{N}(0, \sigma_\nu^2) is noise in the measurement of the feature x, and \epsilon \sim \mathcal{N}(0, \sigma_\epsilon^2) is the usual observation noise. The total prediction error is now \epsilon + w\nu, which critically depends on the parameter w we are trying to estimate. This is no longer a textbook application of Least Squares.
As illustrated in Figure 1.9, applying standard Least Squares in this scenario will result in an estimated slope \hat{w} that is biased towards zero. This is because reducing the magnitude of w not only fits the data but also minimises the variance of the noise term w\nu. This phenomenon is a common source of surprising results.

In fact, this problem is the origin of the term regression itself. In his 1886 paper, “Regression towards mediocrity in hereditary stature,” Francis Galton used Least Squares to compare the heights of parents and their adult children. He observed that tall parents tended to have children who were shorter than them, and short parents tended to have children who were taller. His linear fit had a slope \hat{w} < 1, indicating a “regression to the mean.” The explanation is that both sets of heights are noisy measurements of an underlying genetic predisposition, leading to the bias we have described.
This issue does not arise if the features are known precisely. For instance, if x is a timestamp in a time series, there is no uncertainty, and it is safe to apply LS and any feature transformations.
1.8.2 Example 2: Non-linear Transformations
Consider the following non-linear model with additive Gaussian noise: y = x_1^{w_1} + \epsilon where \epsilon \sim \mathcal{N}(0,1). The model is not linear in the parameters. However, we can linearise it by taking the logarithm of both sides and transforming the features: \begin{aligned} y' & = \log(y) \\ x_1' & = \log(x_1) \end{aligned}
This leads to a model that is linear in the weights: y' = w_1 x_1' + \epsilon' However, the error term \epsilon' is now also a transformed version of the original error \epsilon. Using a first-order Taylor approximation, \log(t + \epsilon) \approx \log(t) + \epsilon/t, we find that: \epsilon' \approx \frac{\epsilon}{x_1^{w_1}} The new error term \epsilon' is no longer independent of the features and weights, and its variance is not constant. This violates the assumptions of standard Least Squares, and applying it to the transformed problem is likely to produce biased estimates.
So, while feature transformations are a powerful tool, it is important to remember that they can alter the statistical properties of the noise, potentially leading to unexpected biases in the results.
In practice, Machine Learning practitioners often adopt a pragmatic approach. While these deviations from the classical assumptions introduce theoretical risks, the method’s simplicity, robustness and performance in many real-world scenarios often outweigh these statistical drawbacks. The key takeaway is to be aware of the risks and to use diagnostic plots (e.g., residual plots) to identify and potentially address severe assumption breaches.
1.9 Takeaways
This chapter has revisited Linear Regression from a Machine Learning perspective. The key takeaways are:
We start with a collection of n training examples, (\mathbf{x}_i, y_i). Each example consists of a feature vector \mathbf{x}_i and a target value y_i.
We postulate a model that is linear in a set of parameters or weights \mathbf{w}, such that our prediction is \hat{y}_i = \mathbf{x}_i^{\top}\mathbf{w}.
We define a loss function to quantify the discrepancy between our predictions and the true values. For least squares, this is the Mean Squared Error (MSE).
We find the optimal weights \hat{\mathbf{w}} by minimising the loss function. For MSE, this leads to a closed-form solution known as the normal equations.
Minimising the MSE loss is equivalent to finding the Maximum Likelihood solution under the assumption that the observation errors are independent and identically distributed according to a Gaussian distribution.
Underfitting occurs when the model is too simple to capture the underlying data patterns. It can be addressed by using a more complex model.
Overfitting occurs when the model is too complex and learns the noise in the training data, failing to generalise to a separate test set. It can be addressed by using more data or by using regularisation.
We can fit non-linear relationships by transforming the input features. However, we must be mindful that these transformations can affect the noise distribution and cause biases in our estimates.
Exercises
Exercise 1.1 Assume {\bf a} = \left[\begin{smallmatrix} a_1 & a_2 & \cdots & a_p\end{smallmatrix}\right]^\top, is a column vector of size p \times 1,
What are the matrix dimensions of
- {\bf a}{\bf a}^{\top}
- {\bf a}^{\top}{\bf a}
- {\bf a}{\bf a}^{\top}{\bf a}{\bf a}^{\top}
- {\bf a}^{\top}{\bf a}{\bf a}^{\top}{\bf a}
Exercise 1.2 Given no assumptions about matrices {\bf A}, {\bf B} and vectors {\bf a} and {\bf b}, compute the gradient \frac{\partial E({\bf w})}{\partial {\bf w}} for
- E({\bf w})={\bf w}^{\top}{\bf w}
- E({\bf w})=({\bf w}-{\bf a})^{\top}{\bf A}({\bf w}-{\bf a}
- E({\bf w})=({\bf A}{\bf w}-{\bf b})^{\top}({\bf A}{\bf w}-{\bf b})
- E({\bf w}) = ({\bf w}-{\bf B}{\bf w})^{\top} {\bf A} ({\bf w}-{\bf a})
Exercise 1.3 Compute the gradient \frac{\partial f({\bf x})}{\partial {\bf x}} for:
- f({\bf x})=\frac{1}{2} {\bf x}^{\top} {\bf A} {\bf x} + b with {\bf A} symmetric
- f({\bf x})=\cos({\bf a}^{\top}{\bf x})
- f({\bf x})=\sum_{i=1}^{n} \lambda_i \exp\left(- \frac{\|{\bf x}-{\bf a}_i\|^2}{2} \right)
Exercise 1.4 Which of the following models with input x_1,x_2, parameters w_1,w_2 and noise \epsilon\sim \mathcal{N}(0,\sigma^2), are linear in the parameters and can be used as such for Least Squares:
- y = w_0 + w_1 x^2 + \epsilon
- y = w_0 x^{w_1} + w_2 + \epsilon
- y = \exp(w_0 + w_1 x) + \epsilon
- \log(y) = w_0 + w_1 x + \epsilon
Exercise 1.5 For n real numbers x_1,\cdots,x_n, what is the value \hat{x} that minimises the sum of squared distances from x to each x_i: \hat{x} = \arg\min_x \sum_{i=1}^{n} (x_i-x)^2
Exercise 1.6 For a linear model {\bf y} = {\bf X}{\bf w} + \boldsymbol{\epsilon}, derive, in a matrix form, the expression of the least square error. That is, for E({\bf w}) = \boldsymbol{\epsilon}^{\top}\boldsymbol{\epsilon} derive the expression of \min_{{\bf w}} E({\bf w}).
Exercise 1.7 An autoregressive model is when a value from a time series is regressed on previous values from that same time series.
x_{t}=w_0+\sum _{{i=1}}^{p}w_{i}x_{{t-i}}+\varepsilon_{t}
write the design matrix for this problem.
Exercise 1.8 Consider the linear model y = w_0 + w_1 x. We want to bias w_1 towards the value 1. Write a loss function that achieves this.